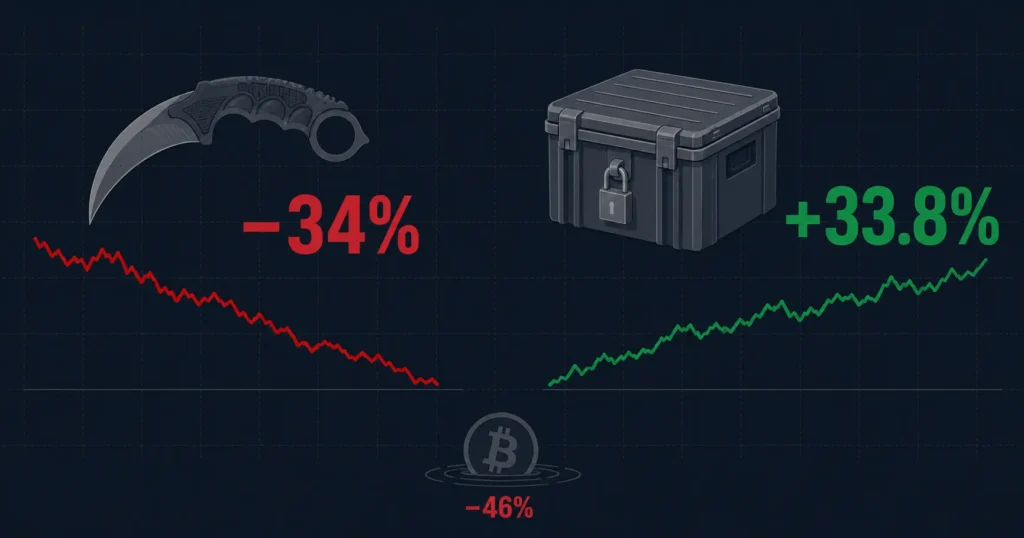
The great skin crash of 2025–2026: knives lost a third of their value and Bitcoin nearly half — but classic Counter-Strike cases rose 33 percent
43 months of data: knives fell 34% and Bitcoin 46% since the September 2025 peak, while classic CS2 cases rose 33%. Skins vs stocks, gold and BTC compared.
For a decade, Counter-Strike skins were celebrated as the best-performing alternative asset money could buy. Academic research published in 2025 found that skin portfolios returned 41.2 percent per year, outperforming the US stock market, real estate and gold. Then came the correction. Between September 2025 and May 2026, the broad skin market lost almost a third of its value — and the question every inventory holder is asking is: how does that compare to everything else?
To answer that question, we tracked nine asset series month by month from November 2022 to June 2026: the EsportFire 300 skin index, three generations of Counter-Strike cases, the knife and glove segments, the S&P 500, Bitcoin and gold — 43 months of public market data in one comparison.
The differences turn out to be large. Knives fell 34.0 percent from their September 2025 peak and gloves 37.8 percent, while the S&P 500 gained another 10.4 percent over the same period. But the most remarkable series in the dataset is the oldest one: cases released between 2016 and 2019 rose 33.2 percent during the crash, and cases from before 2016 rose 33.8 percent.
Across the full 43-month window, cases from the 2020–2022 era are the best performer in the entire comparison at +366.1 percent — ahead of Bitcoin (+256.2 percent), gold (+140.1 percent) and the S&P 500 (+81.0 percent). The broad skin index, by contrast, gained just 26.2 percent.
Check any asset
In the interactive dashboard below you can select any of the nine asset series — from the broad skin index to Bitcoin — and see its full price development, its return since November 2022, its performance since the September 2025 market peak, and how it compares to the S&P 500 over the same window.
All 43 months compared
The table below contains the complete monthly dataset. Index value — the dollar value of each series in that month (skin indexes follow EsportFire methodology; S&P 500, Bitcoin and gold are month-end market prices). Indexed (Nov 2022 = 100) — every series rebased to 100 at the start of the common window, so performance is directly comparable. Sort on any column, toggle the indexed view, or search for a specific month.
Only public market data
This research covers exclusively publicly observable market prices. The skin series follow the EsportFire indexes, which track fixed baskets of items across marketplaces. Individual rare patterns, float premiums and sticker crafts are outside the scope, as are private sales. Traditional asset prices come from Yahoo Finance (S&P 500, gold futures) and public Bitcoin market data. No projections or estimates were added: every number in this study is a recorded market price.
The big picture
Measured across the full common window (November 2022 to June 2026), the ranking looks nothing like the headlines about crashing skins suggest:
| # | Asset | Nov 2022 | Jun 2026 | Return |
|---|---|---|---|---|
| 1 | Cases 2020–2022 (index) | $4.36 | $20.32 | +366.1% |
| 2 | Cases 2016–2019 (index) | $21.12 | $83.34 | +294.6% |
| 3 | Bitcoin | $17,169 | $61,157 | +256.2% |
| 4 | Cases pre-2016 (index) | $145.50 | $367.55 | +152.6% |
| 5 | Gold (per oz) | $1,746 | $4,192 | +140.1% |
| 6 | S&P 500 | 4,080 | 7,387 | +81.0% |
| 7 | EsportFire 300 skin index | $28,853 | $36,417 | +26.2% |
Source: EsportFire Indexes, Yahoo Finance, Blockchain.com. Data retrieved 10 June 2026.
The conclusion that “skins beat stocks” — the headline of the 2025 academic studies — only survives 2026 in one specific form: cases. The broad skin market underperformed every traditional benchmark in this comparison over the full window.
The biggest winners and losers of the crash
Since the market peak of September 2025, the gap between segments has widened to more than 80 percentage points. Gloves lost 37.8 percent and Bitcoin lost 46.4 percent, while classic cases gained a third in value.
Performance since the September 2025 peak (through June 2026)
| # | Asset | Sep 2025 | Jun 2026 | Change |
|---|---|---|---|---|
| 1 | Cases pre-2016 (index) | $274.69 | $367.55 | +33.8% |
| 2 | Cases 2016–2019 (index) | $62.58 | $83.34 | +33.2% |
| 3 | S&P 500 | 6,688 | 7,387 | +10.4% |
| 4 | Gold (per oz) | $3,841 | $4,192 | +9.1% |
| 5 | Cases 2020–2022 (index) | $22.31 | $20.32 | −8.9% |
| 6 | EsportFire 300 skin index | $49,272 | $36,417 | −26.1% |
| 7 | Knives (index) | $1,726,427 | $1,139,049 | −34.0% |
| 8 | Gloves (index) | $576,186 | $358,285 | −37.8% |
| 9 | Bitcoin | $114,056 | $61,157 | −46.4% |
Source: EsportFire Indexes, Yahoo Finance, Blockchain.com. Data retrieved 10 June 2026.
Notable: the biggest loser in this comparison is not a skin segment at all. Bitcoin, which peaked at $115,758 in July 2025, lost nearly half its value by June 2026 — a deeper drawdown than knives, gloves or the broad skin index.
The six skin segments side by side
Within the skin market itself, the crash hit segments very differently. High-value display items (knives, gloves) fell hardest, while sealed containers — the segment with a continuously shrinking supply — kept rising.
| Segment | Since Nov 2022 | Since Sep 2025 peak |
|---|---|---|
| Cases 2020–2022 | +366.1% | −8.9% |
| Cases 2016–2019 | +294.6% | +33.2% |
| Cases pre-2016 | +152.6% | +33.8% |
| Broad skin index (EsportFire 300) | +26.2% | −26.1% |
| Knives | n/a (tracked since Nov 2024) | −34.0% |
| Gloves | n/a (tracked since Nov 2024) | −37.8% |
Source: EsportFire Indexes. Data retrieved 10 June 2026.
Cases versus knives: the flight to scarcity
The pattern in the data resembles a classic flight to quality. Knives and gloves — the most expensive, least liquid items in the market — behave like growth assets: they rose fastest in the 2025 run-up and fell hardest in the correction. Cases behave like a commodity with a hard supply constraint: every case opened is a case permanently removed from circulation, while Valve stopped dropping most older generations years ago. That shrinking float explains why cases from 2016–2019 could rise 33.2 percent through a crash that took a third off the knife segment.
The contrast is sharpest in the crash month itself. In October 2025, gloves fell 26.4 percent and the broad index 22.8 percent in a single month — while cases from 2016–2019 actually gained 2.6 percent.
What happened in October 2025
The September–October 2025 break is the largest single-month move in the entire 43-month dataset. The EsportFire 300 fell from $49,272 to $38,034 — a 22.8 percent drop in one month, wiping out roughly a year of gains. The decline continued in stages until May 2026, when the index bottomed at $33,888, 31.2 percent below the peak. June 2026 shows the first monthly recovery (+7.5 percent to $36,417), which makes the timing of this study relevant: the market is at a potential turning point.
Bitcoin’s decline over the same window was deeper but more gradual: from its July 2025 peak of $115,758 to $61,157 in June 2026, a drawdown of 47.2 percent. Anyone who calls skins a casino should note that the most institutionalised crypto asset fell further than any skin segment in this comparison.
Every asset in detail
Cases 2020–2022 (+366.1% since Nov 2022)
The youngest case generation is the best performer in the entire study. The index rose from $4.36 in November 2022 to $20.32 in June 2026, peaking at $27.74 in July 2025. It was not immune to the correction — it stands 8.9 percent below its September 2025 level — but its full-window return beats Bitcoin by more than 100 percentage points. Low unit prices and a recently closed drop pool make this the segment where supply shrinks fastest relative to demand.
Cases 2016–2019 (+294.6% since Nov 2022)
The strongest crash performer. From $21.12 in November 2022 to $83.34 in June 2026, including a 33.2 percent gain since September 2025. The series peaked at $89.76 in December 2025 — after the skin crash had already started — confirming that capital rotated from display items into sealed containers during the correction.
Cases pre-2016 (+152.6% since Nov 2022)
The oldest and most expensive case generation rose from $145.50 to $367.55 across the window and gained 33.8 percent since the September 2025 peak, hitting an all-time high of $403.45 in March 2026. These cases no longer drop at all, making them the purest scarcity play in the dataset.
Bitcoin (+256.2% since Nov 2022, −46.4% since Sep 2025)
Bitcoin delivered the third-best full-window return but the worst crash performance in the comparison. From $17,169 in November 2022 to a peak of $115,758 in July 2025, followed by a decline to $61,157 in June 2026. Its drawdown of 47.2 percent from peak exceeds that of every skin segment.
Gold (+140.1% since Nov 2022)
Gold nearly tripled across the window, from $1,746 to $4,192 per ounce, and kept rising through the skin and crypto corrections (+9.1 percent since September 2025). In this comparison gold is the only series that combines a triple-digit full-window return with a positive crash performance — apart from classic cases.
S&P 500 (+81.0% since Nov 2022)
The benchmark every alternative asset is measured against gained 81.0 percent over the window and 10.4 percent since September 2025, reaching 7,387 points in June 2026. Over the full window the broad skin index (+26.2 percent) underperformed the S&P 500 by 55 percentage points — the central nuance this study adds to the 2025 academic findings.
EsportFire 300 skin index (+26.2% since Nov 2022, −26.1% since Sep 2025)
The broadest skin benchmark in the dataset, tracking 300 representative items. It peaked at $49,272 in September 2025, bottomed at $33,888 in May 2026 (−31.2 percent) and recovered to $36,417 in June 2026. Its full-window return of 26.2 percent trails every traditional benchmark in the comparison.
Knives (−34.0% since Sep 2025)
Tracked in the dataset since November 2024. The knife segment peaked at $1.73 million (index value) in September 2025 and fell to $1.14 million by June 2026. Knives fell 16.5 percent in October 2025 alone and have declined in seven of the nine months since the peak.
Gloves (−37.8% since Sep 2025)
The hardest-hit skin segment. From a September 2025 peak of $576,186 (index value) to $358,285 in June 2026, including a 26.4 percent fall in October 2025 — the largest single-month decline of any series in the dataset. Notably, gloves stand only 1.4 percent above their November 2024 level: nearly two years of gains evaporated.
Methodology
We compared nine asset series on monthly closing values between November 2022 (the first month with complete data for the broad skin index) and June 2026. Skin data follows the EsportFire indexes: the EsportFire 300 (a fixed basket of 300 representative items), three case-generation indexes, and the knife and glove segment indexes, all denominated in US dollars. The S&P 500 and gold (futures, per troy ounce) come from Yahoo Finance monthly series; Bitcoin prices come from public market data (Blockchain.com / Yahoo Finance). Returns are price returns, excluding dividends on the S&P 500 — including dividends would widen the gap with the skin index further. Knife and glove indexes are available from November 2024, so full-window returns are not reported for those two series. The underlying dataset is available on request.
Sources
EsportFire CS2 Indexes — skin, case, knife and glove series, retrieved 10 June 2026. Yahoo Finance — S&P 500 (^GSPC) and gold futures (GC=F) monthly series, retrieved 10 June 2026. Blockchain.com — Bitcoin market price history, retrieved 10 June 2026. Academic context: F. Reichenbach, “Skin in the game: the returns of digital assets from computer games” (Finance Research Letters, 2025); HSE University, “Counter-Strike skins outperform stocks” (July 2025).
Questions or additions?
Questions about this research, the underlying dataset or the methodology? Journalists can contact us at info@riskyskins.com for the full monthly dataset, custom breakdowns per segment, or commentary.